

NEW LISTING
$3,000,000
2945 Dowell Road, Rockwall 75032
6 _iconbed_ | 5 _iconbath_ | 5,032 SF | 20.00 AC

Where the DFW sprawl ends, the East Texas pace begins, and neighbors actually know each other.
Across the lake from Dallas, Rockwall keeps a small-town feel that’s rare this close to a major city. Lake Ray Hubbard puts real distance—physical and otherwise—between Rockwall and the concrete sprawl on the other side. It’s still only about 20 miles to downtown Dallas—close enough for the commute, but far enough to feel like an entirely different world. If you want the amenities of a major metro area but the soul of a historic, lakeside community, you belong in Rockwall.
| Feature | Why It Matters |
|---|---|
| Primary Zip Codes | 75087 & 75032 |
| Market Style | Historic homes, lakefronts, golf course communities, luxury acreage |
| Key Neighborhoods | The Shores, Historic Downtown, Breezy Hill, Anna Cade Estates |
| Vibe Check | Small-town historic charm with a lakeside, East Texas pace. |
Curious about the historic charm everyone’s talking about? Browse the latest listings below, or call Steavy directly at 214.502.3390 for a private tour of the area’s best-kept secrets.
Swipe, use two fingers on a trackpad, or use the arrows to bring a home into focus. Swipe to bring a home into focus.


You can try reloading the preview, open the full listing in a new tab, or close this window.
A curated look at local favorites, everyday stops, and lifestyle context near this property.
Whenever someone asks where to eat around Rockwall, we always point them straight to the historic downtown square. These three places are absolute staples for us.
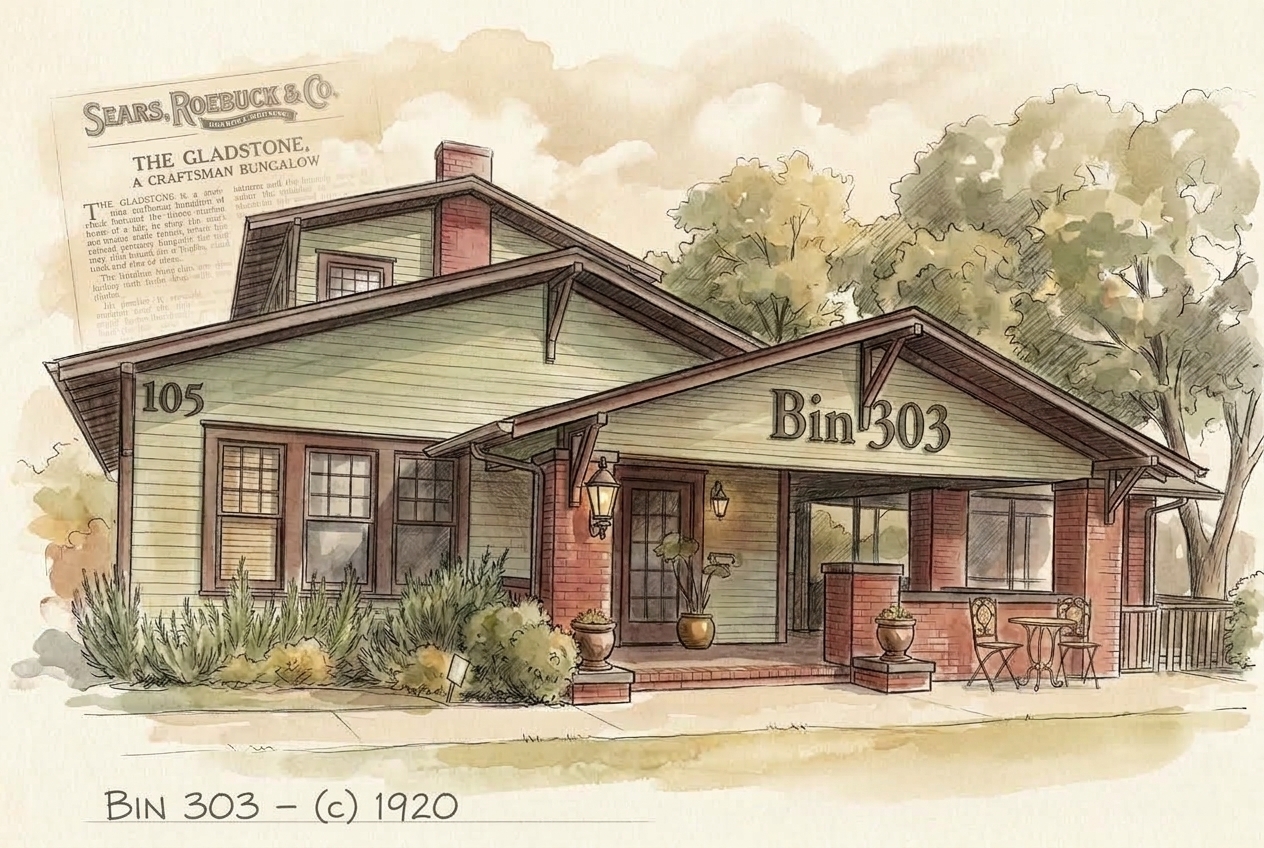
Run by husband and wife team Chef Mat and Breean Nugent, this restaurant sits inside a historic Sears Catalog craftsman home just off the square. The dining areas are small, intimate rooms of the original house, creating a uniquely warm environment. They’ve been here since 2009 and are known for their incredible wood-fired steaks and unique wood-fired caesar salad. We usually order the whiskey marinated pork tenderloin with serrano apple butter, grilled asparagus, and the cheesy bread. The front parlor also houses the bar, which has an incredible cocktail and wine selection.
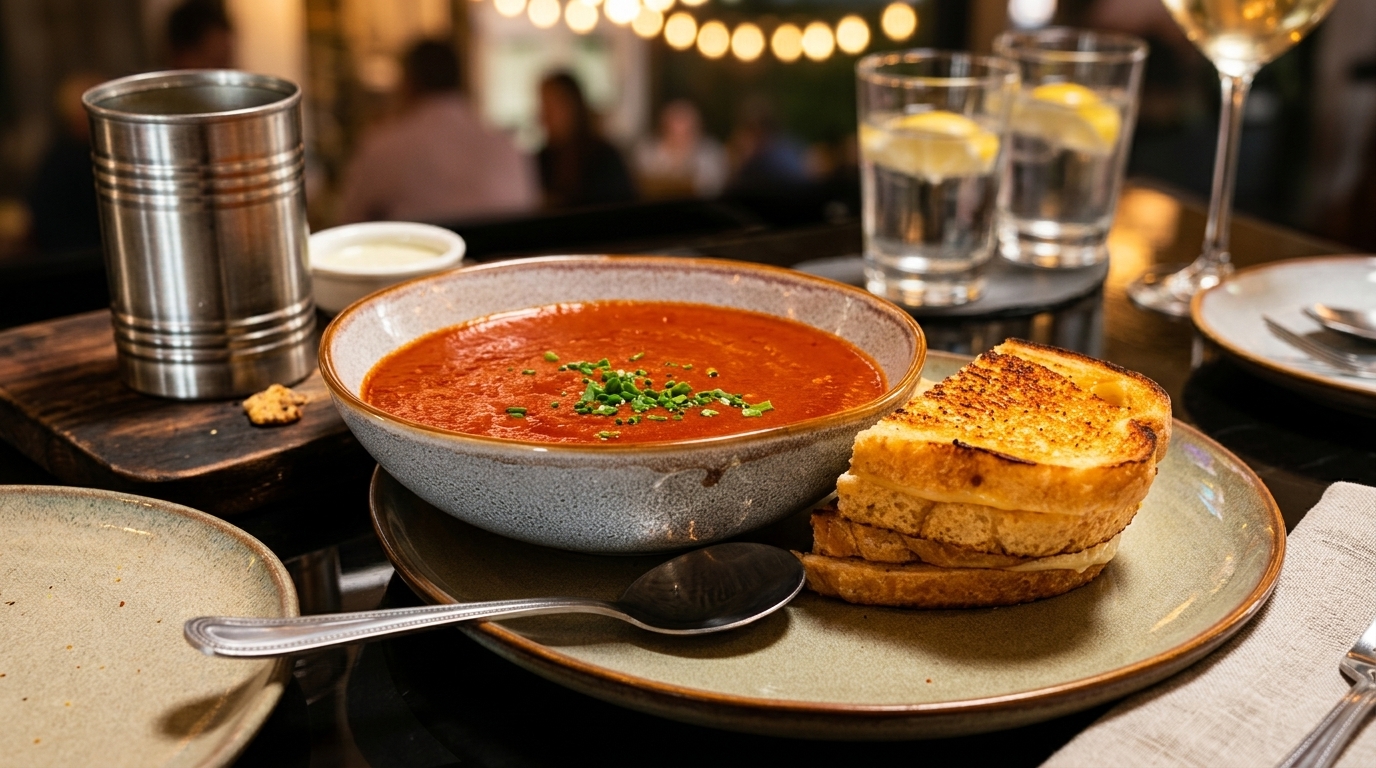
Zanata is located right on the square across from the courthouse, and while there is almost always a line out the door, it is entirely worth the wait. They have two wood-burning pizza ovens where everything is cooked. Our favorite is the San Jacinto pizza with goat cheese, figs, pine nuts, prosciutto, and balsamic. Steavy loves the seasonal pumpkin ravioli, and on a cold day, their tomato bisque soup is perfect. We also always grab the "Z" House Salad. It's an absolute staple for a night out.
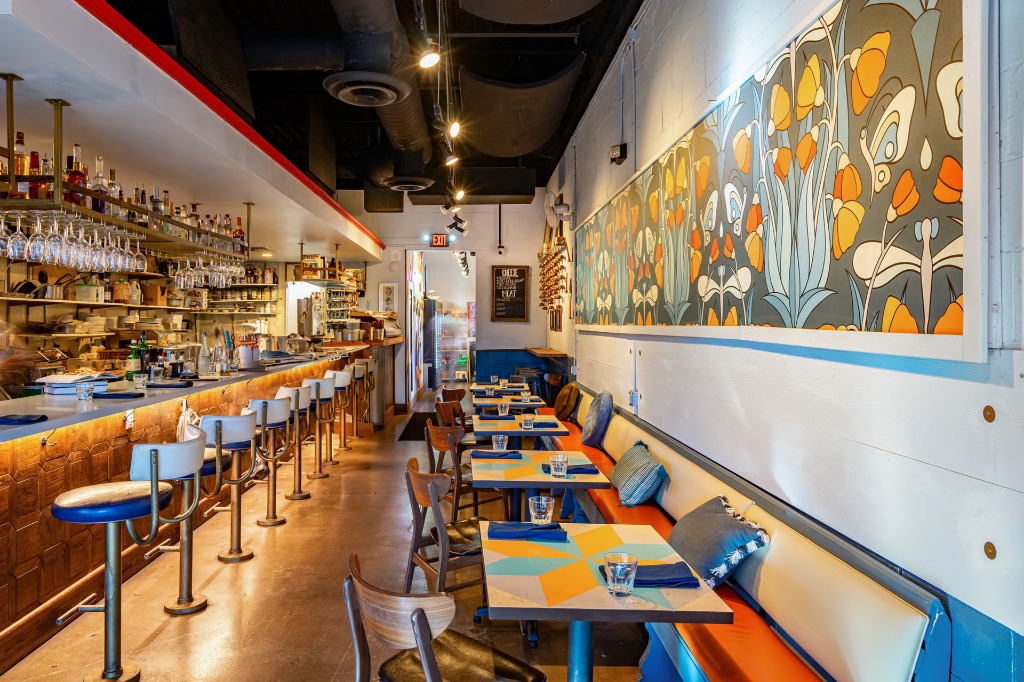
Founded by Rockwall natives and husband-and-wife power couple Chef David and wine expert Jenni Hoffman (two of our absolute favorite people), this cozy tasting room and modern bistro is built around small plates, sandwiches, and craft cocktails. The Cubano and Muffuletta are perfect for lunch, but honestly, the ever-changing menu consistently delivers absolute standouts. A core memory for us is weekend brunch with mimosas in their courtyard—we've been known to sneak our laptops out there and make a whole day of it. They also have an incredibly curated wine club and a fridge full of interesting craft beers.
Explore the full map below — it shows my curated local favorites for the area, plus the closest spots for everyday errands, things to do, and picks for Him, Her, and Date Night.
Rockwall operates in a buyer-favored market where most closed homes sell below county tax appraisal values. Across 208 trailing three-month sales, the median sold price reached $499,475 at $186 per square foot after a median 52 days on market. Closed transactions cleared at a median 5.2% ($24,449) below CAD appraisals, with 67.1% of matched sales closing under tax valuations. Meanwhile, 61.7% of the 355 active listings carry price reductions as median active days on market sits at 91 days.
Buyers hold negotiating leverage across Rockwall as active price cuts and seller concessions remain widespread. An Altos Market Action Index of 28.5 confirms a buyer's advantage across 355 active listings. Sellers contributed concessions in 57.7% of closed transactions, providing a median $10,000 credit. Leverage is strongest in the starter and mid-priced tiers, where 65.8% and 61.3% of sales included seller-paid concessions.
Pricing below or aligned with county appraisal benchmarks is essential to avoid extended market time in Rockwall. Among CAD-matched listings, the 48.6% of sellers who initially priced above tax appraisals waited a median 73 days on market and faced a 55.9% price reduction rate. Conversely, the 51.4% of homes listed below CAD went under contract in a median 23 days with a 38.9% reduction rate. Overall, closed sellers settled for a median 94.7% of original list price, equating to a median $25,000 discount from initial asking.
Seller-paid credits taper steadily as transaction prices climb into upper tiers
Top-tier listings exhibit greater price stability than entry and mid-market homes
Current inventory carries higher price expectations and longer market times than completed transactions
48.6% of sellers in the Rockwall area priced above the county's Central Appraisal District (CAD) value — here’s what happened to each group.
Rockwall market analysis · Multiple verified sources
Two-thirds of CAD-matched sales closed below tax appraisal values, even though nearly half of sellers initially listed above CAD. In the 70-home CAD-matched sample, 48.6% of sellers set their original list price above county appraisal by a median $61,270 (+12.7%), but only 32.9% actually closed above CAD. By closing, 67.1% of matched transactions sold below tax appraisal at a median discount of $39,480 (-9.5%), pulling the overall median closed price to 5.2% ($24,449) under CAD.
Closed sales volume and total dollar volume are climbing year-over-year alongside brisk velocity in closed luxury homes. TRERC data for September 2026 shows 77 closed listings (+8.5% YoY) and 699 year-to-date closings (+10.1% YoY), driving monthly dollar volume up 16.0% YoY to $43.89 million. In the trailing three-month MLS window, homes priced below CAD moved quickly in a median 23 days, and the luxury tier (11 sales) recorded a rapid median 15 days on market with only 36.4% requiring seller concessions.
Elevated active inventory, widespread price reductions, and rising relistings are forcing sellers to discount before securing a contract. Across 355 active listings, the median asking price of $529,000 sits above the $499,475 median closed price, and 61.7% of active listings have cut their price. Furthermore, Redfin tracks 16.6% of listings delisting (+1.6 percentage points YoY) and 15.3% of pending contracts cancelling (+0.1 percentage points YoY), while relistings jumped 31.0% YoY.
Across 208 closed single-family transactions in Rockwall (ZIP 75087) from July through September 2026, the median sold price was $499,475 ($186 per square foot) with a median 52 days on market and 65 cumulative days on market. Sellers achieved a median 98.5% of final list price and 94.7% of original list price, reflecting a median discount of $25,000 (-5.3%) from initial asking. Among 70 CAD-matched sales, the median original list price started 1.3% ($5,180) below appraisal, while the median closed price finished 5.2% ($24,449) below CAD. Specifically, the 34 homes listed above CAD (48.6%) lingered for a median 73 DOM with a 55.9% price reduction rate, whereas the 36 homes listed under CAD (51.4%) closed in a median 23 DOM with a 38.9% cut rate. At closing, 47 homes (67.1%) sold below CAD by a median $39,480 (-9.5%) in a median 34 DOM, while 23 homes (32.9%) closed above CAD by a median $55,792 (+10.9%) in a median 53 DOM.
Seller concessions appeared in 120 of the 208 closed transactions (57.7%), with a median concession of $10,000 representing 2.3% of the sale price. Concession frequency scales inversely with price tier: in the Starter tier ($225,000–$424,895; 73 sales; median sold price $359,000; 39 median DOM), 65.8% of transactions included concessions at a median $9,925 (2.8% of price). In the Mid-Priced tier ($425,000–$580,000; 62 sales; median sold price $499,475; 56.5 median DOM), 61.3% of sales featured concessions with a median contribution of $10,000 (2.1% of price). The High-Priced tier ($590,000–$939,000; 62 sales; median sold price $678,495; 73.5 median DOM) saw concessions in 48.4% of closings at a median $10,750 (1.6% of price). In the Luxury tier ($939,510–$5,600,000; low sample of 11 sales; median sold price $980,000; 15 median DOM), 36.4% of transactions carried concessions at a median $5,000 (0.5% of price).
 MLS 21329730
MLS 21424003
 MLS 21328174
MLS 21422831
 MLS 21335420
 MLS 21322935
 MLS 21369939
 MLS 21419126
 MLS 21391697
 MLS 21370263
 MLS 21406622
 MLS 21398316
 MLS 21369928
 MLS 21385920
MLS 21403949
 MLS 21417305
 MLS 21363995
 MLS 21381173
 MLS 21389671
 MLS 21381168
 MLS 21417371
 MLS 21419177
 MLS 21407855
MLS 21424332
 MLS 21398768
 MLS 21367108
 MLS 21349609
 MLS 21361749
 MLS 21380309
 MLS 21407839
 MLS 21370393
 MLS 21359267
 MLS 21359721
 MLS 21409176
 MLS 21341247
 MLS 21411591
 MLS 21407968
 MLS 21361511
 MLS 21409602
 MLS 21409148
 MLS 21338373
 MLS 21365382
 MLS 21403767
 MLS 21318826
 MLS 21403189
 MLS 21394866
 MLS 21418281
MLS 21393532
 MLS 21398201
 MLS 21341513
 MLS 21391059
 MLS 21348430
 MLS 21396681
 MLS 21396388
 MLS 21396279
 MLS 21395939
 MLS 21321478
 MLS 21397707
 MLS 21400528
MLS 21424746
 MLS 21408319
 MLS 21335421
 MLS 21358250
 MLS 21332329
 MLS 21392865
 MLS 21397431
 MLS 21416286
 MLS 21384427
 MLS 21392662
 MLS 21341490
 MLS 21412254
 MLS 21407825
 MLS 21337780
 MLS 21364632
MLS 21371085
 MLS 21352785
 MLS 21351242
 MLS 21336729
MLS 21422842
 MLS 21394112
 MLS 21366582
 MLS 21392667
MLS 21424056
 MLS 21412972
MLS 21424039
 MLS 21386416
MLS 21424035
 MLS 21409964
 MLS 21326197
 MLS 21375639
 MLS 21325551
 MLS 21391068
MLS 21424096
 MLS 21407863
 MLS 21388744
 MLS 21411639
 MLS 21412643
 MLS 21396382
 MLS 21359236
 MLS 21400301
 MLS 21396035
 MLS 21356321
 MLS 21383000
 MLS 21347022
MLS 21424057
 MLS 21416512
MLS 21420878
 MLS 21392000
 MLS 21410168
MLS 21421394
 MLS 21360994
 MLS 21392663
MLS 21424733
 MLS 21325336
 MLS 21337814
 MLS 21408920
 MLS 21396238
 MLS 21394188
 MLS 21401876
 MLS 21374341
 MLS 21414195
 MLS 21352720
MLS 21414297
 MLS 21386055
 MLS 21413949
 MLS 21330530
 MLS 21356493
 MLS 21420703
 MLS 21418171
 MLS 21413365
 MLS 21390335
 MLS 21330190
 MLS 21400166
 MLS 21340825
 MLS 21351415
 MLS 21371730
 MLS 21377174
 MLS 21393625
 MLS 21386605
MLS 21425510
 MLS 21395060
 MLS 21328495
 MLS 21339197
 MLS 21391434
 MLS 21344608
 MLS 21347221
 MLS 21383091
 MLS 21383562
 MLS 21337793
 MLS 21375214
 MLS 21368081
 MLS 21363932
 MLS 21375308
 MLS 21332199
MLS 21422032
 MLS 21346004
 MLS 21335021
 MLS 21382194
 MLS 21364864
 MLS 21355467
 MLS 21400095
 MLS 21336279
 MLS 21389184
 MLS 21412467
 MLS 21352450
 MLS 21348205
 MLS 21422017
 MLS 21398089
 MLS 21369973
 MLS 21315098
 MLS 21370487
 MLS 21374817
 MLS 21419616
 MLS 21390901
 MLS 21385494
 MLS 21352166
 MLS 21324056
 MLS 21356505
 MLS 21343346
 MLS 21399160
 MLS 21376818
 MLS 21374861
 MLS 21375468
 MLS 21344100
 MLS 21408665
 MLS 21330369
 MLS 21384363
 MLS 21365361
 MLS 21389324
 MLS 21352819
 MLS 21382518
 MLS 21388882
 MLS 21414448
 MLS 21391286
 MLS 21306784
 MLS 21321807
 MLS 21376798
 MLS 21405673
 MLS 21380132
 MLS 21361806
 MLS 21412157
 MLS 21332312
 MLS 21421872
 MLS 21421820
 MLS 21421514
 MLS 21379486
 MLS 21390159
 MLS 21379383
 MLS 21424791
 MLS 21419620
 MLS 21352032
 MLS 21394663
 MLS 21404181
 MLS 21374189
 MLS 21418730
 MLS 21413256
 MLS 21375204
 MLS 21314694
 MLS 21415356
 MLS 21368766
 MLS 21386347
 MLS 21314695
 MLS 21385857
 MLS 21410412
 MLS 21389726
 MLS 21339266
 MLS 21408250
 MLS 21336373
 MLS 21422303
 MLS 21418124
 MLS 21353517
 MLS 21400783
 MLS 21377141
 MLS 21328321
 MLS 21343357
 MLS 21351378
 MLS 21421817
 MLS 21356909
 MLS 21336368
 MLS 21354570
 MLS 21396566
 MLS 21363564
 MLS 21359748
 MLS 21418535
 MLS 21401563
 MLS 21353575
 MLS 21379210
 MLS 21421250
 MLS 21392547
 MLS 21414161
 MLS 21389964
 MLS 21207277
 MLS 21383860
 MLS 21373186
 MLS 21420103
 MLS 21401851
 MLS 21376458
 MLS 21335354
 MLS 21340309
 MLS 21403398
 MLS 21375378
 MLS 21358475
 MLS 21414905
 MLS 21330057
 MLS 21391938
 MLS 21406432
 MLS 21352141
 MLS 21349486
 MLS 21367251
 MLS 21422325
 MLS 21393067
 MLS 21413397
 MLS 21349046
 MLS 21338248
 MLS 21365924
 MLS 21416304
 MLS 21370024
 MLS 21394963
 MLS 21376492
 MLS 21361240
 MLS 21418654
 MLS 21353056
 MLS 21348379
 MLS 21355282
 MLS 21344759
 MLS 21347969
 MLS 21350425
 MLS 21216293
 MLS 21324950
 MLS 21343576
 MLS 21346923
 MLS 21410936
 MLS 21399691
 MLS 21337116
 MLS 21337076
Current upper-tier listings shown for area context. Market statistics reflect the sources, geographies and reporting periods identified in this report.
As of October 30, 2026, Altos Research tracks 355 active listings in Rockwall with an overall Market Action Index of 28.5 (down from 29.5 one month prior), signaling a Buyer's Advantage. Blended active inventory carries a median list price of $529,000 ($189.01 per square foot), a median 91 DOM (mean 146.0 days), a 61.7% price reduction rate, and an 8.2% relist rate, with 12 new listings and 20 absorbed listings. By quartile, Entry-Level (Q1, 88 listings) sits at a median list price of $369,000 ($168.23/sqft), 73 median DOM (106.0 mean DOM), and 65.9% with price cuts. Lower-Middle (Q2, 89 listings) posts a $475,000 median list price ($184.35/sqft), 105 median DOM (151.2 mean DOM), the highest price cut rate at 68.5%, and a 13.5% relist rate. Upper-Middle (Q3, 89 listings) shows a $588,000 median list price ($187.57/sqft), 91 median DOM (157.5 mean DOM), and 62.9% with price decreases. Luxury (Q4, 89 listings) has a $749,900 median list price ($216.35/sqft), 105 median DOM (168.9 mean DOM), the lowest price cut share at 49.4%, and 7.9% of listings increasing prices.
Redfin data for September 2026 highlights persistent price sensitivity and contract friction in ZIP 75087. Active inventory recorded 356 price drops (-11.4% YoY), equating to 54.4% of active listings cutting prices (+1.2 percentage points YoY) by an average price drop of 3.5% (+0.3 percentage points YoY), while 133 homes sold after a price reduction (-2.3% YoY). Contract cancellations totaled 35 transactions (-5.0% YoY), representing 15.3% of pending sales cancelled (+0.1 percentage points YoY). Meanwhile, 109 listings were delisted (-4.0% YoY), pushing the delisted share to 16.6% of listings (+1.6 percentage points YoY), and 38 homes were relisted (+31.0% YoY), raising the relisted share to 5.8% (+2.0 percentage points YoY).
Macro data from TRERC for September 2026 shows 77 closed sales (+8.5% YoY) and 699 year-to-date closings (+10.1% YoY). Monthly dollar volume reached $43,886,919 (+16.0% YoY) with year-to-date volume at $363,893,564 (+6.4% YoY). The TRERC monthly median close price stood at $499,000 (-5.9% YoY; $490,000 YTD), while the average close price rose to $569,959 (+6.9% YoY; $520,591 YTD) amid 377 active end-of-month listings and 4.9 months of inventory. On the construction supply side (Rockwall County Benchmark), single-family building permits reached 90 units in September (+15.4% YoY) with total single-family permit valuation of $28,311,492 (+9.6% YoY), an average unit value of $314,572 (-5.0% YoY), and zero multi-family units permitted.
Want the numbers behind the report?
| Closed Sales Metric | Observed Value |
|---|---|
| Median Sold Price | $499,475 |
| Median Price / Sq Ft | $186 |
| Median Days on Market (DOM) | 52 days |
| Median Cumulative Days on Market (CDOM) | 65 days |
| Sold / Final List Ratio | 98.5% |
| Sold / Original List Ratio | 94.7% |
| Final List / Original List Ratio | 97.3% |
| Difference From Original Ask (%) | -5.3% |
| Difference From Original Ask ($) | -$25,000 |
| Appraisal Position Metric | Observed Difference |
|---|---|
| Original Asking Position vs CAD (%) | -1.3% |
| Original Asking Position vs CAD ($) | -$5,180 |
| Closing Position vs CAD (%) | -5.2% |
| Closing Position vs CAD ($) | -$24,449 |
| Asking-to-Closing Position Gap | 3.86 percentage points |
| CAD Cohort Position | Share (%) | Matched Sales | Price Reduction Rate | CDOM |
|---|---|---|---|---|
| Priced Above CAD (Original List) | 48.6% | 34 | 55.9% | 73 days |
| Priced Below CAD (Original List) | 51.4% | 36 | 38.9% | 30 days |
| Sold Above CAD (Closed Price) | 32.9% | 23 | 39.1% | 53 days |
| Sold Below CAD (Closed Price) | 67.1% | 47 | 51.1% | 56 days |
Sellers are pricing conservatively below county valuations, and final sale prices are dipping even further.
| Tier | Price Range | Sales | Median $/Sq Ft | Median DOM | Concession Rate | Typical Concession |
|---|---|---|---|---|---|---|
| Starter | $225,000–$424,895 | 73 | $177 | 39 days | 65.8% | $9,925 |
| Mid-Priced | $425,000–$580,000 | 62 | $177 | 57 days | 61.3% | $10,000 |
| High-Priced | $590,000–$939,000 | 62 | $196 | 74 days | 48.4% | $10,750 |
| Luxury (low sample) | $939,510–$5,600,000 | 11 | $245 | 15 days | 36.4% | $5,000 |
| Blended Total | All Price Tiers | 208 | $186 | 52 days | 57.7% | $10,000 |
*Low sample size in Luxury tier (<15 sales); interpret this segment cautiously.
| Altos Market Summary | Current Metric |
|---|---|
| Market Action Index (MAI) | 28.50 |
| Market Condition | Buyer's Advantage |
| MAI One Month Ago | 29.46 |
| Median Asking Price | $529,000 |
| Median Asking Price / Sq Ft | $189.01 |
| Median Days on Market (DOM) | 91 days |
| Active Listings With Price Decreases | 61.7% |
| Active Listing Count | 355 |
| Quartile | Median Price | $/Sq Ft | Median Sq Ft | Lot Size | Beds | Baths | Median DOM | Mean DOM | % Decreased | % Relisted | Count |
|---|---|---|---|---|---|---|---|---|---|---|---|
| Entry-Level | $369,000 | $168.23 | 2,075 | 0.16 ac | 3 | 2.0 | 73 | 106.0 | 65.9% | 5.7% | 88 |
| Lower-Middle | $475,000 | $184.35 | 2,620 | 0.19 ac | 4 | 3.0 | 105 | 151.2 | 68.5% | 13.5% | 89 |
| Upper-Middle | $588,000 | $187.57 | 3,165 | 0.20 ac | 4 | 3.5 | 91 | 157.5 | 62.9% | 7.9% | 89 |
| Luxury (Top 25%) | $749,900 | $216.35 | 3,705 | 0.21 ac | 4 | 4.0 | 105 | 168.9 | 49.4% | 5.6% | 89 |
| Blended Total | $529,000 | $189.01 | 2,887 | 0.20 ac | 4 | 3.0 | 91 | 146.0 | 61.7% | 8.2% | 355 |
| Behavior & Contract Metric | Monthly Total | Count YoY | Current Share | Share YoY |
|---|---|---|---|---|
| Active Listings with Price Drops | 356 | -11.4% | 54.4% | +1.2 pts |
| Delisted / Off-Market Without Sale | 109 | -4.0% | 16.6% | +1.6 pts |
| Relisted Properties | 38 | +31.0% | 5.8% | +2.0 pts |
| Pending Contracts Cancelled | 35 | -5.0% | 15.3% | +0.1 pts |
| Rockwall Metric | Current Value | YoY Change (%) |
|---|---|---|
| Closed Sales | 77 | +8.5% |
| YTD Closed Sales | 699 | +10.1% |
| Dollar Volume | $43,886,919 | +16.0% |
| Median Close Price | $499,000 | -5.9% |
| Average Close Price | $569,959 | +6.9% |
| Active Listings (End of Month) | 377 | N/A |
| Months of Inventory | 4.90 mos | N/A |
| Building Permit Metric | Current Value | YoY Change (%) |
|---|---|---|
| Single-Family Permits | 90 units | +15.4% |
| Total Permit Valuation | $28,311,492 | +9.6% |
| Average Permit Value | $314,572 | -5.0% |